Everything about Pandas Library - Beginner
Introduction
If you do not know what Pandas is, it’s a python library for data manipulation, data cleaning and data analysis. There are other libraries like Numpy (Pandas is built on top of this), Scipy as well which help in data analysis. They provide a lot of functionalities which help in achieving this. It helps this process of analysis by providing ways to filter out redundant data, fill null information with some sensible data, extracting insights out of existing data, plot graphs for data visualization etc. So let’s get started.
Data Structures in Pandas
Pandas support three types of data structures -Series, DataFrame and Panel. Series is a 1-Dimensional array. DataFrame is a 2-Dimensional array (i.e. table). Panel is 3-Dimensional Array. But Series and DataFrame are the most commonly used ones.
Setting up the Environment
Before getting started with Pandas you need to have it installed on your environment. Simply install it by typing sudo pip install pandas in the terminal. Another simpler way is by installing Anaconda Distribution available here (Note: This distribution includes not just the pandas library, but a lot of other python libraries as well).
Reading a data file in Pandas
Pandas supports a lot of data formats (Read about it here). But the most commonly used data format is CSV.
Let’s get started by taking the training dataset from Kaggle. Now create a new .py file and import the pandas library.
import pandas as pd
Use the read_csv function to load the csv file into the DataFrame.
data = pd.read_csv(‘train.csv’)
The above command might take time based on the number of rows and columns in the csv file.
If you want to customize the way the file is read you can provide it with attributes as well. Some commonly used attributes like headers, delimiter can also be used. You can read more about it here.
.shape and .dtypes
shape property of the dataframe returns a tuple containing number of rows and columns in the dataset.
data.shape
dtypes property of the dataframe returns all the columns in the dataset along with the datatype of each column. Something as shown below.

Using head() and tail() in pandas
head method is used to print first 5 rows of the dataset. By default this function returns 5 rows, but you can return as many rows as you want by passing the row count to the head function. Something as shown below.
data.head(7)
The above command prints the first 7 rows of the dataframe.
Similar to head function, you can use tail function to print the last ‘n’ rows of the dataframe using tail function.
data.tail(4)
Using describe()
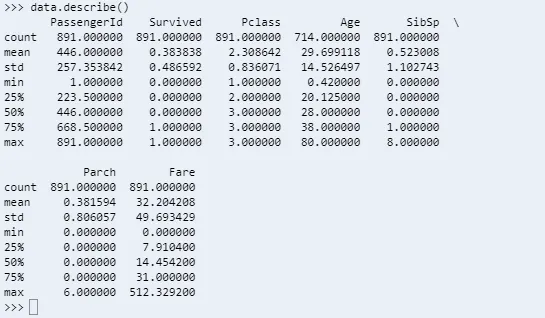
Describe function gives a rough idea of how data is distributed over the range of values in the dataset. It prints out the minimum, maximum, mean, standard deviation, lower upper and 50th(median) percentiles. This is the case for columns having numeric data types as shown below.
data.describe()
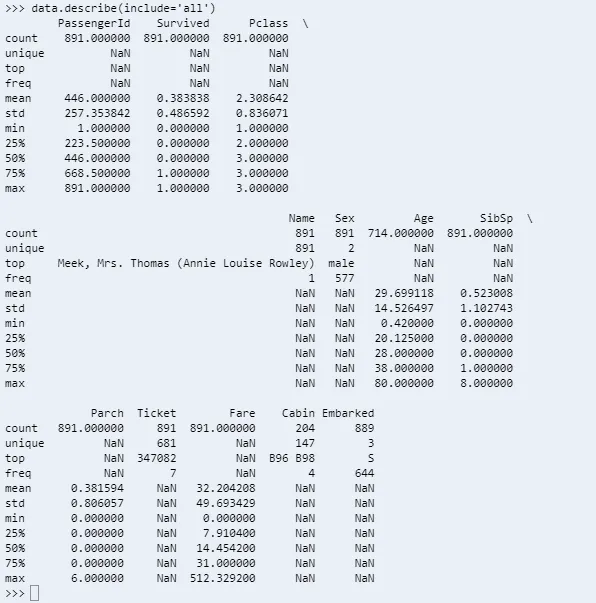
For string and timestamp columns the describe function prints unique, top and frequency information also.
data.describe(include=’all’)
You can read more about describe function here
Selecting columns
Pandas supports multiple ways to select columns
-
By Column Name
data.Namedata[‘Name’] -
Over a range of rows
data[100:500] -
By Column Index
data.iloc[200:500,1:5]This means take rows from 200 to 499 and columns 1,2,3 and 4
-
Conditional selection:
data[data.Age>18]This selects all the rows of the dataframe where age is greater than 18
Adding new columns to the dataframe
Certain situations you might want to create a new column in the dataframe by combining other data columns. Below shown code will concatenate Name and Gender columns of the dataframe.
data[‘Name Gender’]=data[‘Name’]+ ‘-‘ +data[‘Sex’]
Sorting
Dataframe can be sorted using the sort_values function in pandas. You can simply sort the values by a column name by following way.
data.sort_values(by=’Name’)
You can customize the way the values are sorted, read more about it here.
Creating new dataframe out of existing one
This is usually used to filter out unnecessary data out of the dataframe.
filteredData = data[data.Sex = ‘female’]
Here I am creating a new dataframe having only female passengers information
String Functions
-
Adds a new column to the dataframe which has the length of the description column.
data[‘description_len’] = data[‘description’].str.len() -
Convert string to lowercase or uppercase
data[‘Name_Lower’] = data[‘Name’].str.lower()data[‘Name_Upper’] = data[‘Name’].str.upper()
Math Functions
-
Finding out mean
data.mean() -
Finding out median
data.median()
Writing to DataFrame to a File
Once you are done making the neccessary changes to the DataFrame, you can save it to csv file using to_csv function as shown below.
data.to_csv(‘newfilename.csv’)
Read more about writing to a file here.
Conclusion
This is just the beginner part of Pandas library. There are lot of other features that are available in this library like Grouping, Joining, plotting graphs etc. I will be discussing about these in another blog.